CONCEPTS AND DEFINITIONS
QUALITY FUNCTION DEPLOYMENT(QFD) is a structured approach to defining customer needs or requirements and translating them into specific plans to produce products to meet those needs. The "voice of the customer" is the term to describe these stated and unstated customer needs or requirements. |
|
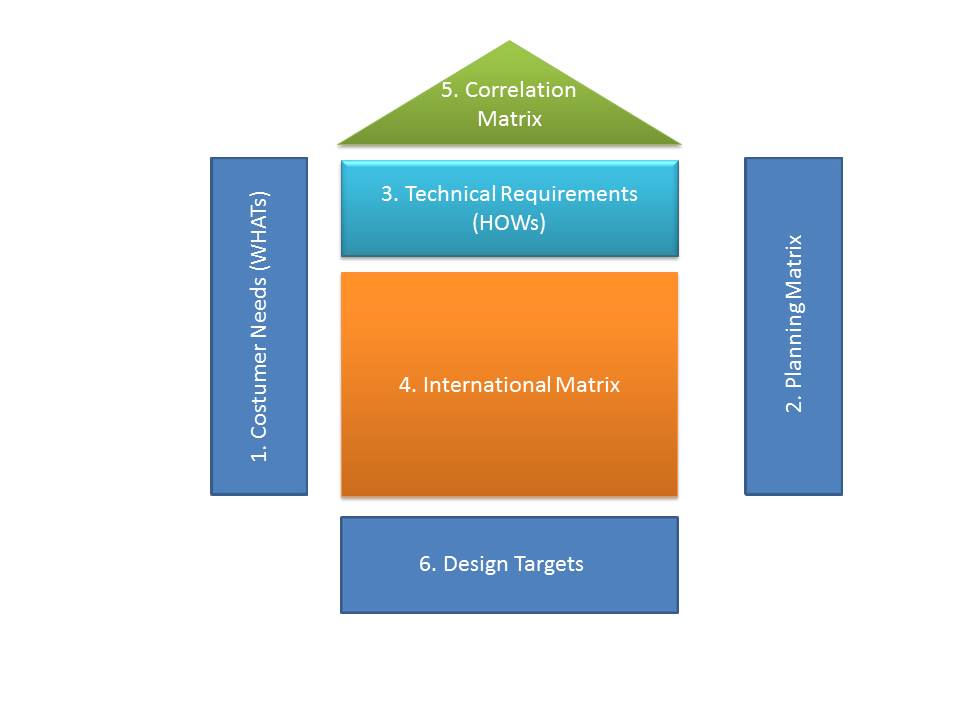
THE WHAT IN THE QFD MATRIX
The QDF team must work diligently to determine what potential customer would like to see in terms of attributes and features of the product and also what they do not like about the current product. The team in other words, should assemble sufficient information on what characteristics, attributes and features customers say they need. Once all this information is gathered, the data must be sorted into a prioritized set of the most important customer needs and then start using QFD tools; the first one will be Affinity Diagram.
THE HOWs IN THE QFD MATRIX
The technical requirements for the HOQ states how the company intends to respond to each of the Customer Needs. These are characteristics and features of a product that is perceived as meeting the customer needs. They are measured in term of satisfactory achievements. The input of these attributes come within the company.
INTERRELATIONSHIP VALUES IN QFD MATRIX 1, 3, 9
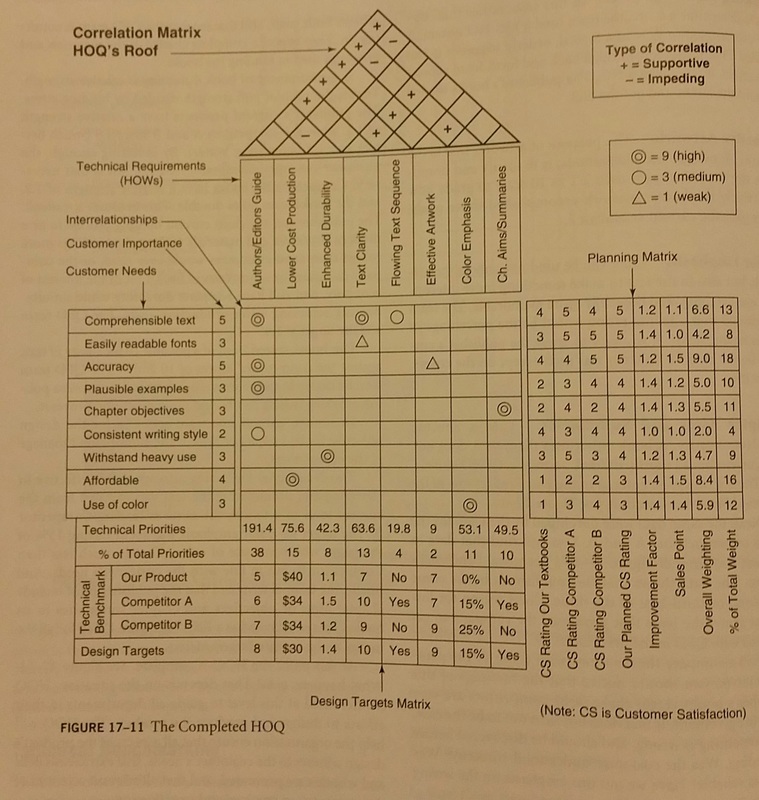
CALCULATING TECHNICAL PRIORITIES IN THE DESIGN TARGET MATRIX
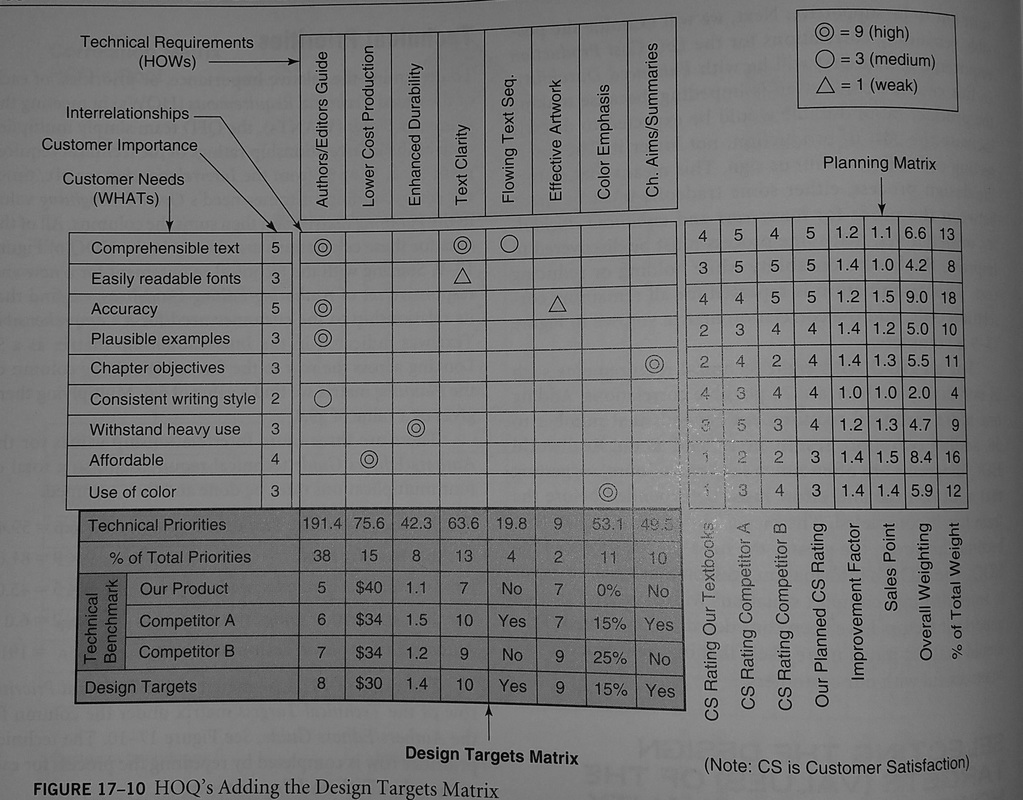
|
To determine the relative importance, or priorities, of each of the stated Technical Requirements (HOWs) in meeting the Customer Needs (WANTs), the QFD simply multiplies each of the interrelationships ratings of the technical requirement (0,1,3, or 9) from the Interrelationship matrix, times the corresponding customer need's Overall Weighting value in the Planning matrix; and then sums the column. |
STATISTICAL PROCESS CONTROL
It is a statistical method of separating special-cause variation from natural variation to eliminate the special causes and to establish and maintain consistency in the process, enabling process improvement. SPC is essential worldwide today to elevate the quality of products and services, while lowering costs, to compete successfully in the world's market.s.
CONTROL CHART FOR VARIABLES EXAMPLE
The following is a mathematical example that illustrates the control chart construction fro variables:
This example will measure the first 10 spaces produced after 9:00 am, 1 pm, 5 pm, and 9 pm. This example will assume calculations for 3 days, for a total of 120 points in 12 sub-groups.
This example will measure the first 10 spaces produced after 9:00 am, 1 pm, 5 pm, and 9 pm. This example will assume calculations for 3 days, for a total of 120 points in 12 sub-groups.
CONTROL CHART FOR ATTRIBUTES EXAMPLE
CONTROL CHARTS FOR CONTINUAL QUALITY IMPROVEMENT
Control charts are fundamental for continual improvement. They provide alerts when special causes are at work in the process, and they promt investigation and correction. Continual improvement is a key element of SPC and total quality and control charts are very helpful in trying yo achieve this. Control charts identify special causes that need to be eliminated and then controls that the data is within the control limits, so that work can begin on process improvement. Once the improvement is implemented, control charts, will either ratify the improvement or reveal that the anticipated results were not achieved.
THE USE OF CONTROL CHARTS FOR QUALITY IMPROVEMENTS
Control charts enhance the predictability of processes and whole plants. It helps identify causes that limit quality improvement within organization and permits to help promote quality improvement, while reducing product cost.
